Chart.js - библиотека для построения диаграмм
Официальная страница [http://www.chartjs.org/]
Chart
-
class
chartjs.Chart(context) <script> var ctx = document.getElementById("myChart").getContext("2d"); var myNewChart = new Chart(ctx).PolarArea(data); </script> <canvas id="myChart"></canvas>
-
defaults.global Стандартные настройки для всех видов диаграмм
// одиночное изменение парамета
Chart.defaults.global.animation = false;

// все параметры
Chart.defaults.global = {
    // булево - вкл/выкл анимацию
    animation: true,

    // число - количество шагов анимации
    animationSteps: 60,

    // строка - тип анимации
    // linear

    // easeInBack
    // easeInBounce
    // easeInCirc
    // easeInCubic
    // easeInElastic
    // easeInExpo
    // easeInOutElastic
    // easeInOutBack
    // easeInOutBounce
    // easeInOutCirc
    // easeInOutCubic
    // easeInOutExpo
    // easeInOutQuad
    // easeInOutQuart
    // easeInOutQuint
    // easeInOutSine
    // easeInQuad
    // easeInQuart
    // easeInQuint
    // easeInSine

    // easeOutBack
    // easeOutBounce
    // easeOutCirc
    // easeOutCubic
    // easeOutElastic
    // easeOutExpo
    // easeOutQuad
    // easeOutQuart
    // easeOutQuint
    // easeOutSine
    animationEasing: "easeOutQuart",

    // Boolean - If we should show the scale at all
    showScale: true,

    // Boolean - If we want to override with a hard coded scale
    scaleOverride: false,

    // ** Required if scaleOverride is true **
    // Number - The number of steps in a hard coded scale
    scaleSteps: null,
    // Number - The value jump in the hard coded scale
    scaleStepWidth: null,
    // Number - The scale starting value
    scaleStartValue: null,

    // строка - цвет линии
    scaleLineColor: "rgba(0,0,0,.1)",

    // Number - Pixel width of the scale line
    scaleLineWidth: 1,

    // Boolean - Whether to show labels on the scale
    scaleShowLabels: true,

    // Interpolated JS string - can access value
    scaleLabel: "<%=value%>",

    // Boolean - Whether the scale should stick to integers, not floats even if drawing space is there
    scaleIntegersOnly: true,

    // Boolean - Whether the scale should start at zero, or an order of magnitude down from the lowest value
    scaleBeginAtZero: false,

    // String - Scale label font declaration for the scale label
    scaleFontFamily: "'Helvetica Neue', 'Helvetica', 'Arial', sans-serif",

    // Number - Scale label font size in pixels
    scaleFontSize: 12,

    // String - Scale label font weight style
    scaleFontStyle: "normal",

    // строка - цвет заливки
    scaleFontColor: "#666",

    // Boolean - whether or not the chart should be responsive and resize when the browser does.
    responsive: false,

    // Boolean - whether to maintain the starting aspect ratio or not when responsive, if set to false, will take up entire container
    maintainAspectRatio: true,

    // Boolean - Determines whether to draw tooltips on the canvas or not
    showTooltips: true,

    // функция - обработчик вывода подсказки при наведении мышкой на точку диаграммы
    customTooltips: false,
    /*
     * {
     *   customTooltips: function(tooltip) {
     *
     *       // tooltip will be false if tooltip is not visible or should be hidden
     *       if (!tooltip) {
     *           return;
     *       }
     *
     *        // Otherwise, tooltip will be an object with all tooltip properties like:
     *
     *       // tooltip.caretHeight
     *       // tooltip.caretPadding
     *       // tooltip.chart
     *       // tooltip.cornerRadius
     *       // tooltip.fillColor
     *       // tooltip.font...
     *       // tooltip.text
     *       // tooltip.x
     *       // tooltip.y
     *       // etc...
     *
     *   };
     */


    // список - список поддерживаемых ивентов
    tooltipEvents: ["mousemove", "touchstart", "touchmove"],

    // String - Tooltip background colour
    tooltipFillColor: "rgba(0,0,0,0.8)",

    // String - Tooltip label font declaration for the scale label
    tooltipFontFamily: "'Helvetica Neue', 'Helvetica', 'Arial', sans-serif",

    // Number - Tooltip label font size in pixels
    tooltipFontSize: 14,

    // String - Tooltip font weight style
    tooltipFontStyle: "normal",

    // String - Tooltip label font colour
    tooltipFontColor: "#fff",

    // String - Tooltip title font declaration for the scale label
    tooltipTitleFontFamily: "'Helvetica Neue', 'Helvetica', 'Arial', sans-serif",

    // Number - Tooltip title font size in pixels
    tooltipTitleFontSize: 14,

    // String - Tooltip title font weight style
    tooltipTitleFontStyle: "bold",

    // String - Tooltip title font colour
    tooltipTitleFontColor: "#fff",

    // Number - pixel width of padding around tooltip text
    tooltipYPadding: 6,

    // Number - pixel width of padding around tooltip text
    tooltipXPadding: 6,

    // Number - Size of the caret on the tooltip
    tooltipCaretSize: 8,

    // Number - Pixel radius of the tooltip border
    tooltipCornerRadius: 6,

    // Number - Pixel offset from point x to tooltip edge
    tooltipXOffset: 10,

    // String - Template string for single tooltips
    tooltipTemplate: "<%if (label){%><%=label%>: <%}%><%= value %>",

    // String - Template string for multiple tooltips
    multiTooltipTemplate: "<%= value %>",

    // Function - Will fire on animation progression.
    onAnimationProgress: function(){},

    // Function - Will fire on animation completion.
    onAnimationComplete: function(){}
}
-
defaults.Bar Стандартные настройки для всех диаграмм
Chart.Bar
-
defaults.Doughnut Стандартные настройки для всех диаграмм
Chart.Doughnut
-
defaults.Line Стандартные настройки для всех диаграмм
Chart.Line
-
defaults.PolarArea Стандартные настройки для всех диаграмм
Chart.PolarArea
-
defaults.Radar Стандартные настройки для всех диаграмм
Chart.Radar
-
Bar
-
class
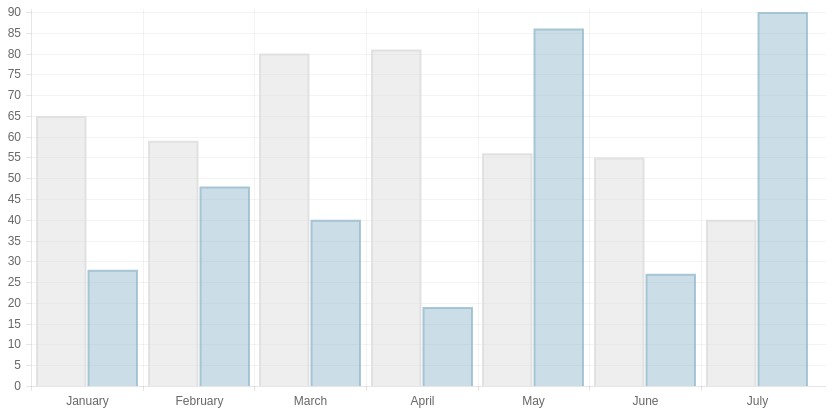
Chart.Bar Диаграмма
var data = {
    labels: ["January", "February", "March", "April", "May", "June", "July"],
    datasets: [
        {
            label: "My First dataset",
            fillColor: "rgba(220,220,220,0.5)",
            strokeColor: "rgba(220,220,220,0.8)",
            highlightFill: "rgba(220,220,220,0.75)",
            highlightStroke: "rgba(220,220,220,1)",
            data: [65, 59, 80, 81, 56, 55, 40]
        },
        {
            label: "My Second dataset",
            fillColor: "rgba(151,187,205,0.5)",
            strokeColor: "rgba(151,187,205,0.8)",
            highlightFill: "rgba(151,187,205,0.75)",
            highlightStroke: "rgba(151,187,205,1)",
            data: [28, 48, 40, 19, 86, 27, 90]
        }
    ]
};

var options = {
    //Boolean - Whether the scale should start at zero, or an order of magnitude down from the lowest value
    scaleBeginAtZero : true,

    //Boolean - Whether grid lines are shown across the chart
    scaleShowGridLines : true,

    //String - Colour of the grid lines
    scaleGridLineColor : "rgba(0,0,0,.05)",

    //Number - Width of the grid lines
    scaleGridLineWidth : 1,

    //Boolean - Whether to show horizontal lines (except X axis)
    scaleShowHorizontalLines: true,

    //Boolean - Whether to show vertical lines (except Y axis)
    scaleShowVerticalLines: true,

    //Boolean - If there is a stroke on each bar
    barShowStroke : true,

    //Number - Pixel width of the bar stroke
    barStrokeWidth : 2,

    //Number - Spacing between each of the X value sets
    barValueSpacing : 5,

    //Number - Spacing between data sets within X values
    barDatasetSpacing : 1,

    //String - A legend template
    legendTemplate : "<ul class=\"<%=name.toLowerCase()%>-legend\"><% for (var i=0; i<datasets.length; i++){%><li><span style=\"background-color:<%=datasets[i].fillColor%>\"></span><%if(datasets[i].label){%><%=datasets[i].label%><%}%></li><%}%></ul>"

}

var myBarChart = new Chart(ctx).Bar(data, options);
-
addData(valuesArray, label) Добавляет данные в диаграмму, данные также отобразятся визуально.
// The values array passed into addData should be one for each dataset in the chart
myBarChart.addData([40, 60], "August");
// This new data will now animate at the end of the chart.
-
getBarsAtEvent(event) Возвращает данные по ивенту
canvas.onclick = function(evt){
    var activeBars = myBarChart.getBarsAtEvent(evt);
    // => activeBars is an array of bars on the canvas that are at the same position as the click event.
};
-
removeData() Удаляет первый элемент во всех графиках
myBarChart.removeData();
// The chart will remove the first point and animate other points into place
-
update() Перерисовывает диаграмму
myBarChart.datasets[0].points[2].value = 50;
// Would update the first dataset's value of 'March' to be 50
myBarChart.update();
// Calling update now animates the position of March from 90 to 50.
-
Doughnut
-
class
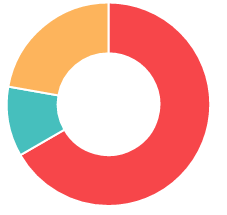
Chart.Doughnut Диаграмма
var data = [
    {
        value: 300,
        color:"#F7464A",
        highlight: "#FF5A5E",
        label: "Red"
    },
    {
        value: 50,
        color: "#46BFBD",
        highlight: "#5AD3D1",
        label: "Green"
    },
    {
        value: 100,
        color: "#FDB45C",
        highlight: "#FFC870",
        label: "Yellow"
    }
]

var options = {
    //Boolean - Whether we should show a stroke on each segment
    segmentShowStroke : true,

    //String - The colour of each segment stroke
    segmentStrokeColor : "#fff",

    //Number - The width of each segment stroke
    segmentStrokeWidth : 2,

    //Number - The percentage of the chart that we cut out of the middle
    percentageInnerCutout : 50, // This is 0 for Pie charts

    //Number - Amount of animation steps
    animationSteps : 100,

    //String - Animation easing effect
    animationEasing : "easeOutBounce",

    //Boolean - Whether we animate the rotation of the Doughnut
    animateRotate : true,

    //Boolean - Whether we animate scaling the Doughnut from the centre
    animateScale : false,

    //String - A legend template
    legendTemplate : "<ul class=\"<%=name.toLowerCase()%>-legend\"><% for (var i=0; i<segments.length; i++){%><li><span style=\"background-color:<%=segments[i].fillColor%>\"></span><%if(segments[i].label){%><%=segments[i].label%><%}%></li><%}%></ul>"

}

var myDoughnutChart = new Chart(ctx[0]).Doughnut(data,options);
-
addData(segmentData, index) Добавляет данные в диаграмму, данные также отобразятся визуально.
// An object in the same format as the original data source
myDoughnutChart.addData({
    value: 130,
    color: "#B48EAD",
    highlight: "#C69CBE",
    label: "Purple"
});
// The new segment will now animate in.
-
removeData(index) Удаляет элемент во всех графиках
index - удаляемый индекс, необязательный параметр, если не задан то удалится последний сегмент
myDoughnutChart.removeData();
// The chart will remove the first point and animate other points into place
-
update() Перерисовывает диаграмму
myDoughnutChart.segments[1].value = 10;
// Would update the first dataset's value of 'Green' to be 10
myDoughnutChart.update();
// Calling update now animates the position of Green from 50 to 10.
-
Line
-
class
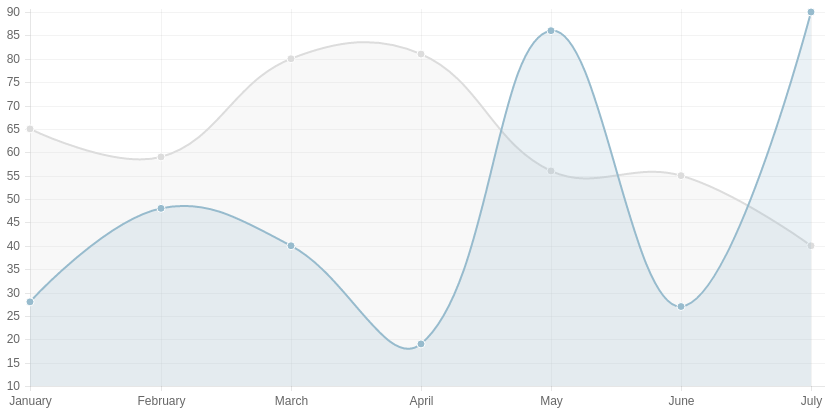
Chart.Line Диаграмма
var data = {
    labels: ["January", "February", "March", "April", "May", "June", "July"],
    datasets: [
        {
            label: "My First dataset",
            fillColor: "rgba(220,220,220,0.2)",
            strokeColor: "rgba(220,220,220,1)",
            pointColor: "rgba(220,220,220,1)",
            pointStrokeColor: "#fff",
            pointHighlightFill: "#fff",
            pointHighlightStroke: "rgba(220,220,220,1)",
            data: [65, 59, 80, 81, 56, 55, 40]
        },
        {
            label: "My Second dataset",
            fillColor: "rgba(151,187,205,0.2)",
            strokeColor: "rgba(151,187,205,1)",
            pointColor: "rgba(151,187,205,1)",
            pointStrokeColor: "#fff",
            pointHighlightFill: "#fff",
            pointHighlightStroke: "rgba(151,187,205,1)",
            data: [28, 48, 40, 19, 86, 27, 90]
        }
    ]
};

var options = {

    ///Boolean - Whether grid lines are shown across the chart
    scaleShowGridLines : true,

    //String - Colour of the grid lines
    scaleGridLineColor : "rgba(0,0,0,.05)",

    //Number - Width of the grid lines
    scaleGridLineWidth : 1,

    //Boolean - Whether to show horizontal lines (except X axis)
    scaleShowHorizontalLines: true,

    //Boolean - Whether to show vertical lines (except Y axis)
    scaleShowVerticalLines: true,

    //Boolean - Whether the line is curved between points
    bezierCurve : true,

    //Number - Tension of the bezier curve between points
    bezierCurveTension : 0.4,

    //Boolean - Whether to show a dot for each point
    pointDot : true,

    //Number - Radius of each point dot in pixels
    pointDotRadius : 4,

    //Number - Pixel width of point dot stroke
    pointDotStrokeWidth : 1,

    //Number - amount extra to add to the radius to cater for hit detection outside the drawn point
    pointHitDetectionRadius : 20,

    //Boolean - Whether to show a stroke for datasets
    datasetStroke : true,

    //Number - Pixel width of dataset stroke
    datasetStrokeWidth : 2,

    //Boolean - Whether to fill the dataset with a colour
    datasetFill : true,

    //String - A legend template
    legendTemplate : "<ul class=\"<%=name.toLowerCase()%>-legend\"><% for (var i=0; i<datasets.length; i++){%><li><span style=\"background-color:<%=datasets[i].strokeColor%>\"></span><%if(datasets[i].label){%><%=datasets[i].label%><%}%></li><%}%></ul>"

};

var myLineChart = new Chart(ctx).Line(data, options);
-
addData(valuesArray, label) Добавляет данные в диаграмму, данные также отобразятся визуально.
// The values array passed into addData should be one for each dataset in the chart
myLineChart.addData([40, 60], "August");
// This new data will now animate at the end of the chart.
-
getPointsAtEvent(event) Возвращает данные по ивенту
canvas.onclick = function(evt){
    var activePoints = myLineChart.getPointsAtEvent(evt);
    // => activePoints is an array of points on the canvas that are at the same position as the click event.
};
-
removeData() Удаляет первый элемент во всех графиках
myLineChart.removeData();
// The chart will remove the first point and animate other points into place
-
update() Перерисовывает диаграмму
myLineChart.datasets[0].points[2].value = 50;
// Would update the first dataset's value of 'March' to be 50
myLineChart.update();
// Calling update now animates the position of March from 90 to 50.
-
Pie
-
class
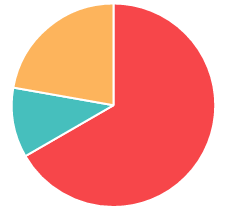
Chart.Pie Диаграмма
var data = [
    {
        value: 300,
        color:"#F7464A",
        highlight: "#FF5A5E",
        label: "Red"
    },
    {
        value: 50,
        color: "#46BFBD",
        highlight: "#5AD3D1",
        label: "Green"
    },
    {
        value: 100,
        color: "#FDB45C",
        highlight: "#FFC870",
        label: "Yellow"
    }
]

var options = {
    //Boolean - Whether we should show a stroke on each segment
    segmentShowStroke : true,

    //String - The colour of each segment stroke
    segmentStrokeColor : "#fff",

    //Number - The width of each segment stroke
    segmentStrokeWidth : 2,

    //Number - The percentage of the chart that we cut out of the middle
    percentageInnerCutout : 50, // This is 0 for Pie charts

    //Number - Amount of animation steps
    animationSteps : 100,

    //String - Animation easing effect
    animationEasing : "easeOutBounce",

    //Boolean - Whether we animate the rotation of the Doughnut
    animateRotate : true,

    //Boolean - Whether we animate scaling the Doughnut from the centre
    animateScale : false,

    //String - A legend template
    legendTemplate : "<ul class=\"<%=name.toLowerCase()%>-legend\"><% for (var i=0; i<segments.length; i++){%><li><span style=\"background-color:<%=segments[i].fillColor%>\"></span><%if(segments[i].label){%><%=segments[i].label%><%}%></li><%}%></ul>"

}

var myPieChart = new Chart(ctx[0]).Pie(data,options);
-
addData(segmentData, index) Добавляет данные в диаграмму, данные также отобразятся визуально.
// An object in the same format as the original data source
myPieChart.addData({
    value: 130,
    color: "#B48EAD",
    highlight: "#C69CBE",
    label: "Purple"
});
// The new segment will now animate in.
-
removeData(index) Удаляет элемент во всех графиках
index - удаляемый индекс, необязательный параметр, если не задан то удалится последний сегмент
myPieChart.removeData();
// The chart will remove the first point and animate other points into place
-
update() Перерисовывает диаграмму
myPieChart.segments[1].value = 10;
// Would update the first dataset's value of 'Green' to be 10
myPieChart.update();
// Calling update now animates the position of Green from 50 to 10.
-
PolarArea
-
class
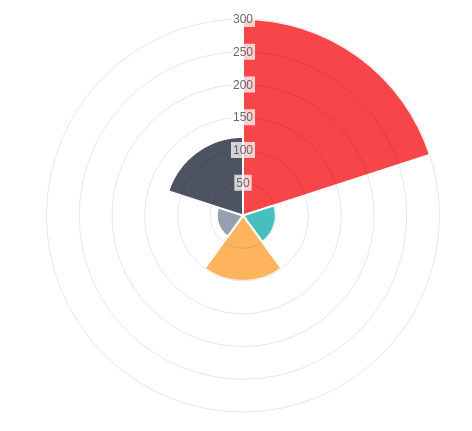
Chart.PolarArea Диаграмма создается используя
PolarArea()var data = [ { value: 300, color:"#F7464A", highlight: "#FF5A5E", label: "Red" }, { value: 50, color: "#46BFBD", highlight: "#5AD3D1", label: "Green" }, { value: 100, color: "#FDB45C", highlight: "#FFC870", label: "Yellow" }, { value: 40, color: "#949FB1", highlight: "#A8B3C5", label: "Grey" }, { value: 120, color: "#4D5360", highlight: "#616774", label: "Dark Grey" } ]; var options = { //Boolean - Show a backdrop to the scale label scaleShowLabelBackdrop : true, //String - The colour of the label backdrop scaleBackdropColor : "rgba(255,255,255,0.75)", // Boolean - Whether the scale should begin at zero scaleBeginAtZero : true, //Number - The backdrop padding above & below the label in pixels scaleBackdropPaddingY : 2, //Number - The backdrop padding to the side of the label in pixels scaleBackdropPaddingX : 2, //Boolean - Show line for each value in the scale scaleShowLine : true, //Boolean - Stroke a line around each segment in the chart segmentShowStroke : true, //String - The colour of the stroke on each segement. segmentStrokeColor : "#fff", //Number - The width of the stroke value in pixels segmentStrokeWidth : 2, //Number - Amount of animation steps animationSteps : 100, //String - Animation easing effect. animationEasing : "easeOutBounce", //Boolean - Whether to animate the rotation of the chart animateRotate : true, //Boolean - Whether to animate scaling the chart from the centre animateScale : false, //String - A legend template legendTemplate : "<ul class=\"<%=name.toLowerCase()%>-legend\"><% for (var i=0; i<segments.length; i++){%><li><span style=\"background-color:<%=segments[i].fillColor%>\"></span><%if(segments[i].label){%><%=segments[i].label%><%}%></li><%}%></ul>" } var myPolarArea = new Chart(ctx).PolarArea(data, options);
-
addData(segmentData, index) Добавляет данные в диаграмму, данные также отобразятся визуально.
// An object in the same format as the original data source
myPolarAreaChart.addData({
    value: 130,
    color: "#B48EAD",
    highlight: "#C69CBE",
    label: "Purple"
});
// The new segment will now animate in.
-
getSegmentsAtEvent(event) Возвращает данные по ивенту
canvas.onclick = function(evt){
    var activePoints = myPolarAreaChart.getSegmentsAtEvent(evt);
    // => activePoints is an array of segments on the canvas that are at the same position as the click event.
};
-
removeData(index) Удаляет элемент во всех графиках
index - удаляемый индекс, необязательный параметр, если не задан то удалится последний сегмент
myRadarChart.removeData();
// The chart will remove the first point and animate other points into place
-
update() Перерисовывает диаграмму
myPolarAreaChart.segments[1].value = 10;
// Would update the first dataset's value of 'Green' to be 10
myPolarAreaChart.update();
// Calling update now animates the position of Green from 50 to 10.
-
Radar
-
class
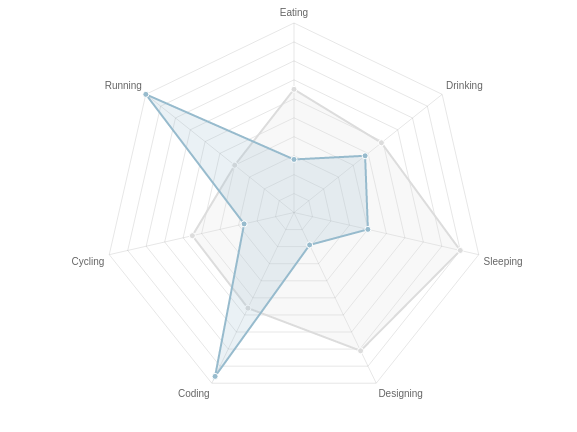
Chart.Radar Диаграмма
var data = {
    labels: ["Eating", "Drinking", "Sleeping", "Designing", "Coding", "Cycling", "Running"],
    datasets: [
        {
            label: "My First dataset",
            fillColor: "rgba(220,220,220,0.2)",
            strokeColor: "rgba(220,220,220,1)",
            pointColor: "rgba(220,220,220,1)",
            pointStrokeColor: "#fff",
            pointHighlightFill: "#fff",
            pointHighlightStroke: "rgba(220,220,220,1)",
            data: [65, 59, 90, 81, 56, 55, 40]
        },
        {
            label: "My Second dataset",
            fillColor: "rgba(151,187,205,0.2)",
            strokeColor: "rgba(151,187,205,1)",
            pointColor: "rgba(151,187,205,1)",
            pointStrokeColor: "#fff",
            pointHighlightFill: "#fff",
            pointHighlightStroke: "rgba(151,187,205,1)",
            data: [28, 48, 40, 19, 96, 27, 100]
        }
    ]
};

var options = {
    //Boolean - Whether to show lines for each scale point
    scaleShowLine : true,

    //Boolean - Whether we show the angle lines out of the radar
    angleShowLineOut : true,

    //Boolean - Whether to show labels on the scale
    scaleShowLabels : false,

    // Boolean - Whether the scale should begin at zero
    scaleBeginAtZero : true,

    //String - Colour of the angle line
    angleLineColor : "rgba(0,0,0,.1)",

    //Number - Pixel width of the angle line
    angleLineWidth : 1,

    //String - Point label font declaration
    pointLabelFontFamily : "'Arial'",

    //String - Point label font weight
    pointLabelFontStyle : "normal",

    //Number - Point label font size in pixels
    pointLabelFontSize : 10,

    //String - Point label font colour
    pointLabelFontColor : "#666",

    //Boolean - Whether to show a dot for each point
    pointDot : true,

    //Number - Radius of each point dot in pixels
    pointDotRadius : 3,

    //Number - Pixel width of point dot stroke
    pointDotStrokeWidth : 1,

    //Number - amount extra to add to the radius to cater for hit detection outside the drawn point
    pointHitDetectionRadius : 20,

    //Boolean - Whether to show a stroke for datasets
    datasetStroke : true,

    //Number - Pixel width of dataset stroke
    datasetStrokeWidth : 2,

    //Boolean - Whether to fill the dataset with a colour
    datasetFill : true,

    //String - A legend template
    legendTemplate : "<ul class=\"<%=name.toLowerCase()%>-legend\"><% for (var i=0; i<datasets.length; i++){%><li><span style=\"background-color:<%=datasets[i].strokeColor%>\"></span><%if(datasets[i].label){%><%=datasets[i].label%><%}%></li><%}%></ul>"

}

var myRadarChart = new Chart(ctx).Radar(data, options);
-
addData(valuesArray, label) Добавляет данные в диаграмму, данные также отобразятся визуально.
// The values array passed into addData should be one for each dataset in the chart
myRadarChart.addData([40, 60], "August");
// This new data will now animate at the end of the chart.
-
getPointsAtEvent(event) Возвращает данные по ивенту
canvas.onclick = function(evt){
    var activePoints = myRadarChart.getPointsAtEvent(evt);
    // => activePoints is an array of points on the canvas that are at the same position as the click event.
};
-
removeData() Удаляет первый элемент во всех графиках
myRadarChart.removeData();
// The chart will remove the first point and animate other points into place
-
update() Перерисовывает диаграмму
myRadarChart.datasets[0].points[2].value = 50;
// Would update the first dataset's value of 'March' to be 50
myRadarChart.update();
// Calling update now animates the position of March from 90 to 50.
-
Базовые методы прототипов всех диаграмм
-
chartjs.clear() Очищает канвас
-
chartjs.destroy() Удаляет диаграмму
-
chartjs.generateLegend() Возвращает HTML, сгенерированная легенда для диаграммы
document.getElementById("legendDiv").innerHTML = myLineChart.generateLegend();
-
chartjs.resize() Изменяет размер канваса
-
chartjs.stop() Останавливает анимацию
-
chartjs.toBase64Image() Возвращает изображение диаграммы, закодированное в base 64
Добавление новых типов диаграмм
Chart.Type.extend({
    // Passing in a name registers this chart in the Chart namespace
    name: "Scatter",
    // Providing a defaults will also register the deafults in the chart namespace
    defaults : {
        options: "Here",
        available: "at this.options"
    },
    // Initialize is fired when the chart is initialized - Data is passed in as a parameter
    // Config is automatically merged by the core of Chart.js, and is available at this.options
    initialize:  function(data){
        this.chart.ctx // The drawing context for this chart
        this.chart.canvas // the canvas node for this chart
    },
    // Used to draw something on the canvas
    draw: function() {
    }
});

// Now we can create a new instance of our chart, using the Chart.js API
new Chart(ctx).Scatter(data);
// initialize is now run
Расширение существующих диаграмм
// Notice now we're extending the particular Line chart type, rather than the base class.
Chart.types.Line.extend({
    // Passing in a name registers this chart in the Chart namespace in the same way
    name: "LineAlt",
    initialize: function(data){
        console.log('My Line chart extension');
        Chart.types.Line.prototype.initialize.apply(this, arguments);
    }
});

// Creates a line chart in the same way
new Chart(ctx).LineAlt(data);
// but this logs 'My Line chart extension' in the console.